时间分析
在本章中,我们将提高生命游戏实现的性能。 我们将使用时间分析来指导我们的工作。
在继续之前熟悉 用于时间分析 Rust 和 WebAssembly 代码的可用工具。
使用 window.performance.now 函数创建每秒帧数计时器
当我们研究加速生命游戏的渲染时,这个 FPS 计时器将非常有用。
我们首先向 wasm-game-of-life/www/index.js 添加一个 fps 对象:
const fps = new class {
  constructor() {
    this.fps = document.getElementById("fps");
    this.frames = [];
    this.lastFrameTimeStamp = performance.now();
  }

  render() {
    // Convert the delta time since the last frame render into a measure
    // of frames per second.
    const now = performance.now();
    const delta = now - this.lastFrameTimeStamp;
    this.lastFrameTimeStamp = now;
    const fps = 1 / delta * 1000;

    // Save only the latest 100 timings.
    this.frames.push(fps);
    if (this.frames.length > 100) {
      this.frames.shift();
    }

    // Find the max, min, and mean of our 100 latest timings.
    let min = Infinity;
    let max = -Infinity;
    let sum = 0;
    for (let i = 0; i < this.frames.length; i++) {
      sum += this.frames[i];
      min = Math.min(this.frames[i], min);
      max = Math.max(this.frames[i], max);
    }
    let mean = sum / this.frames.length;

    // Render the statistics.
    this.fps.textContent = `
Frames per Second:
         latest = ${Math.round(fps)}
avg of last 100 = ${Math.round(mean)}
min of last 100 = ${Math.round(min)}
max of last 100 = ${Math.round(max)}
`.trim();
  }
};
接下来我们在 renderLoop 的每次迭代中调用 fps render 函数:
const renderLoop = () => {
    fps.render(); //new

    universe.tick();
    drawGrid();
    drawCells();

    animationId = requestAnimationFrame(renderLoop);
};
最后,不要忘记将 fps 元素添加到 wasm-game-of-life/www/index.html,就在 <canvas> 的上方:
<div id="fps"></div>
并添加 CSS 以使其格式更好:
#fps {
  white-space: pre;
  font-family: monospace;
}
瞧! 刷新 http://localhost:8080 现在我们有了一个 FPS 计数器!
使用 console.time 和 console.timeEnd 为每个 Universe::tick 计时
为了测量每次调用 Universe::tick 需要多长时间,我们可以通过 web-sys crate 使用 console.time 和 console.timeEnd。
首先,将 web-sys 作为依赖添加到 wasm-game-of-life/Cargo.toml:
[dependencies.web-sys]
version = "0.3"
features = [
  "console",
]
因为每个 console.time 调用都应该有一个相应的 console.timeEnd 调用,所以将它们都包装在 RAII 类型中会很方便:
#![allow(unused)]
fn main() {
extern crate web_sys;
use web_sys::console;

pub struct Timer<'a> {
    name: &'a str,
}

impl<'a> Timer<'a> {
    pub fn new(name: &'a str) -> Timer<'a> {
        console::time_with_label(name);
        Timer { name }
    }
}

impl<'a> Drop for Timer<'a> {
    fn drop(&mut self) {
        console::time_end_with_label(self.name);
    }
}
}
然后,我们可以通过将此代码段添加到方法的顶部来计算每个 Universe::tick 花费的时间:
#![allow(unused)]
fn main() {
let _timer = Timer::new("Universe::tick");
}
每次调用 Universe::tick 花费的时间现在记录在控制台中:
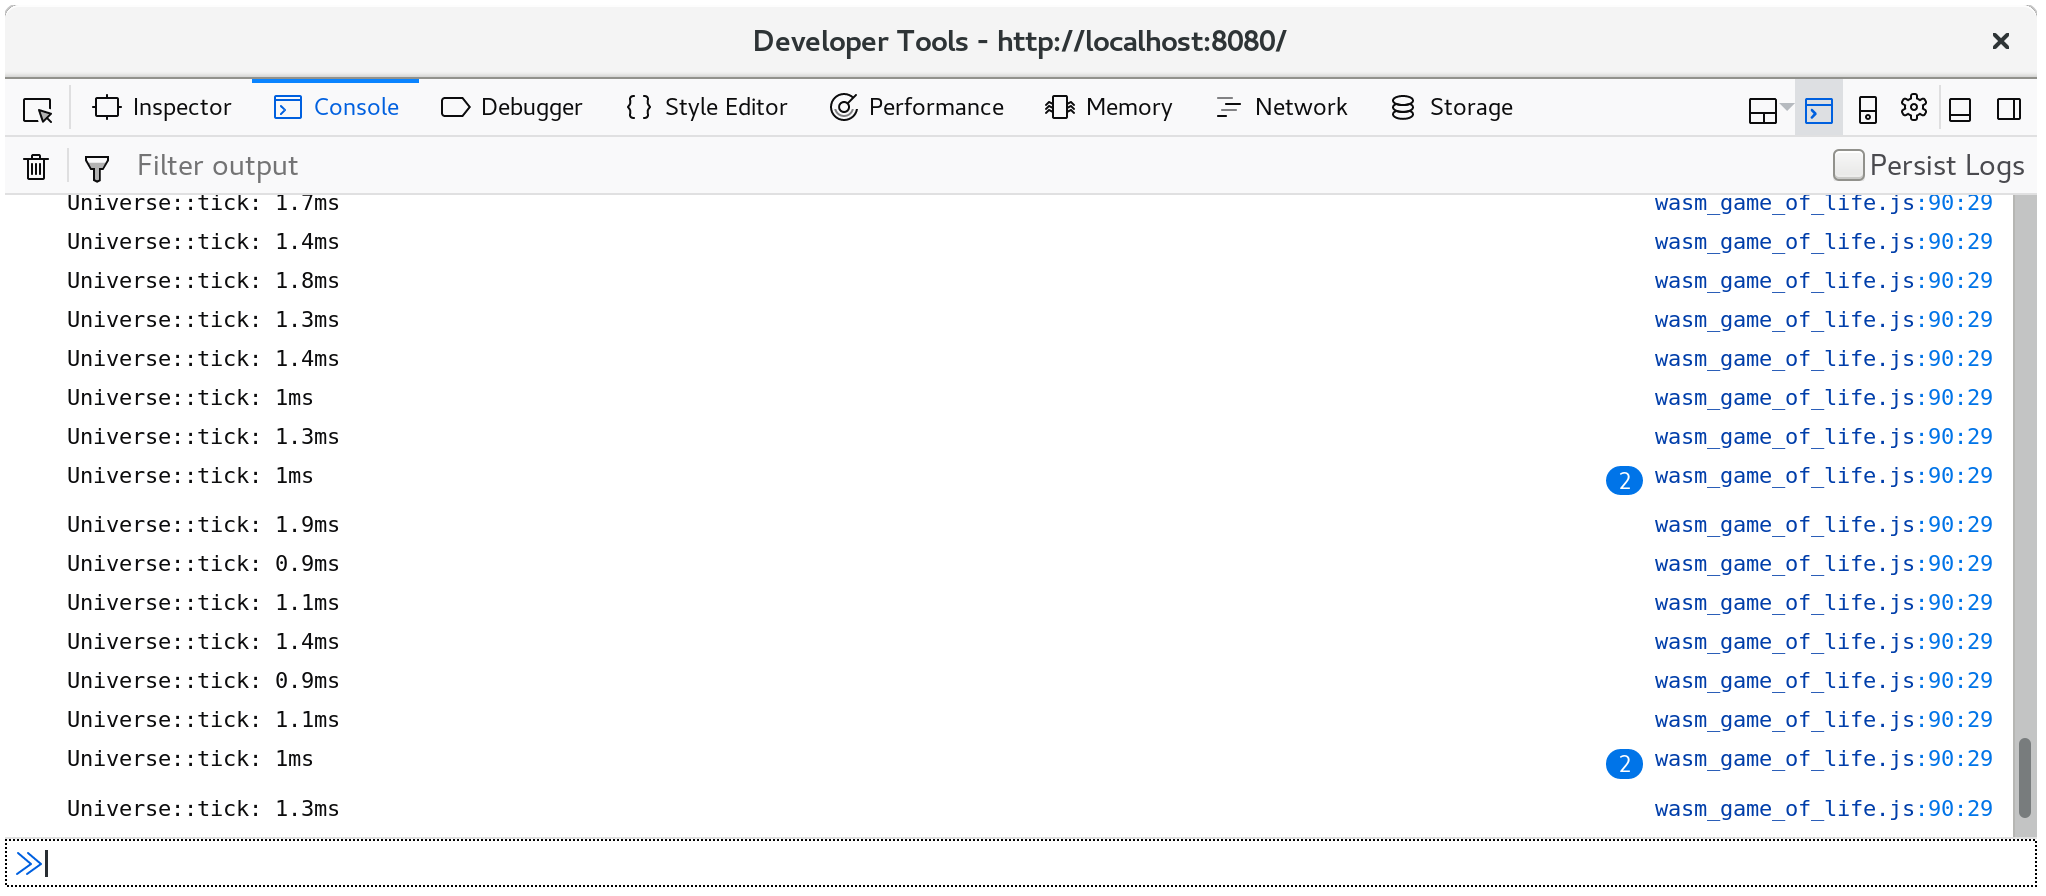
此外,console.time 和 console.timeEnd 对将显示在浏览器的分析器的 “时间轴” 或“ 瀑布” 视图中:
发展我们的生命游戏宇宙
⚠️ 本节使用来自 Firefox 的示例屏幕截图。 虽然所有现代浏览器都有类似的工具,但使用不同的开发人员工具可能会有细微的差别。 您提取的配置文件信息将基本相同,但您所看到的视图和不同工具的命名可能会有所不同。
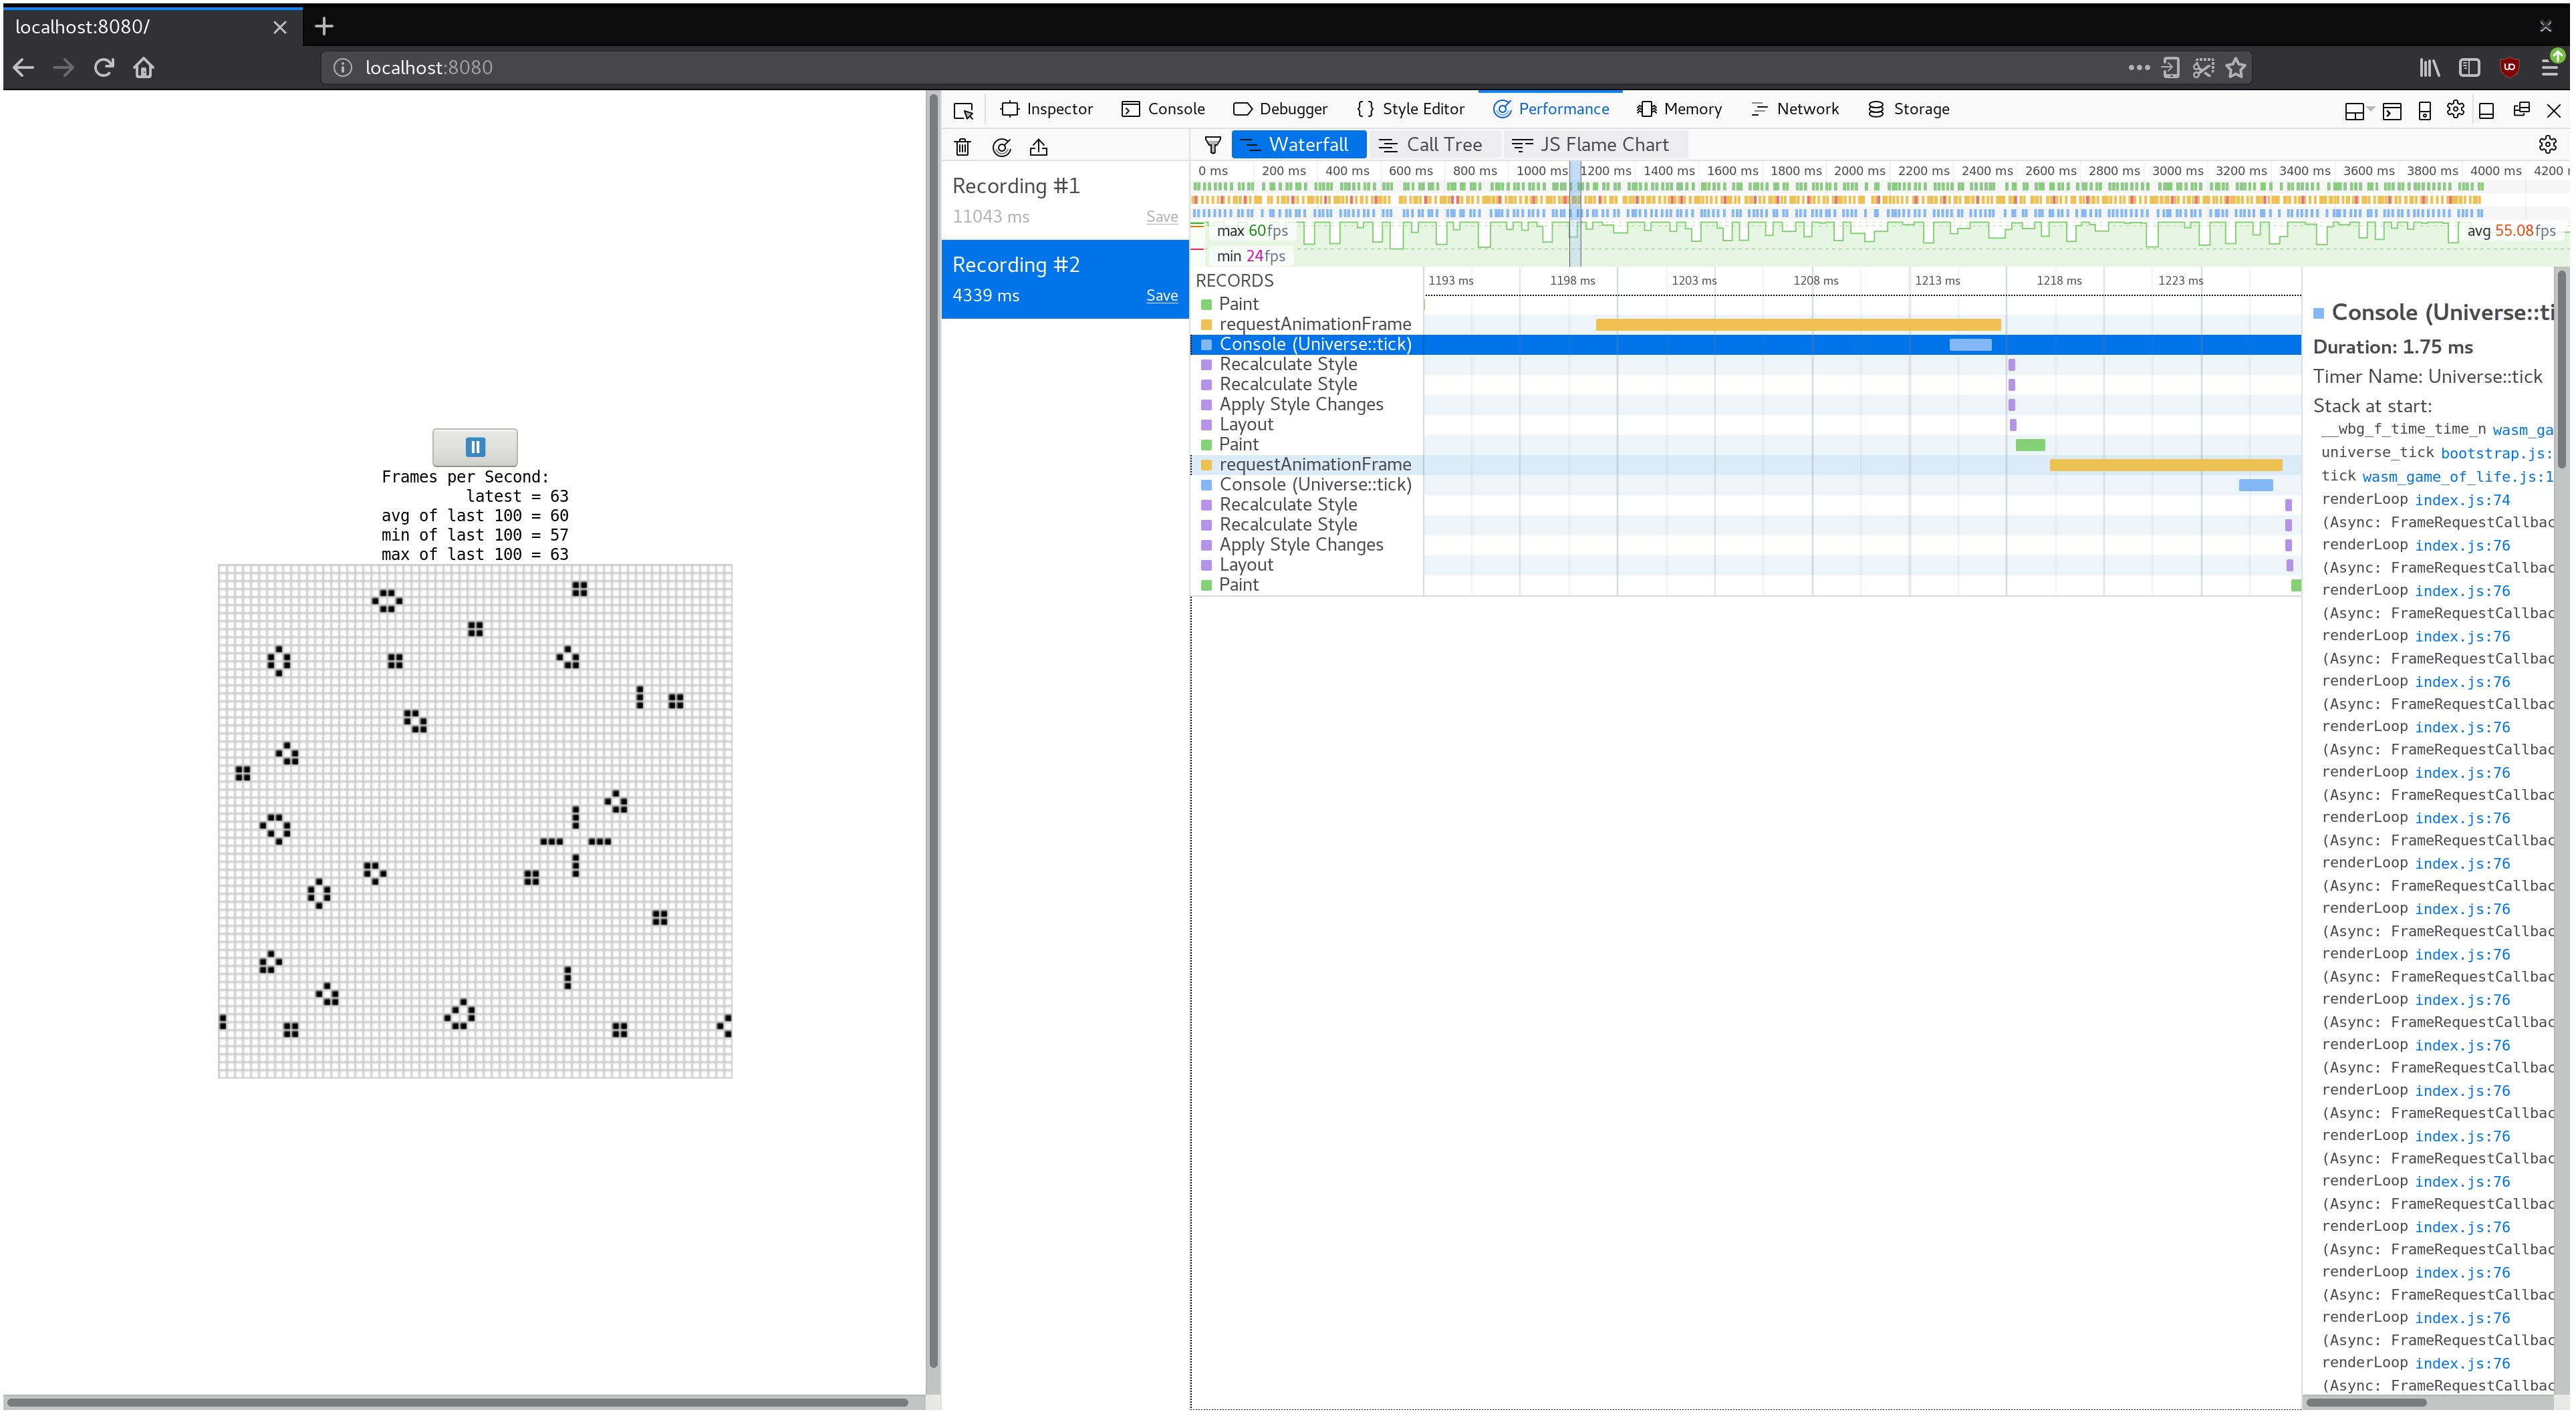
如果我们让生命游戏的宇宙更大,会发生什么? 用 128 x 128 Universe 替换 64 x 64 Universe(通过修改 wasm-game-of-life/src/lib.rs 中的 Universe::new)导致 FPS 从平滑的 60 下降到不稳定的 40-ish 在我的机器上。
如果我们记录一个配置文件并查看瀑布视图,我们会看到每个动画帧花费了 20 毫秒以上。 回想一下,每秒 60 帧为渲染一帧的整个过程留下了 16 毫秒。 这不仅仅是我们的 JavaScript 和 WebAssembly,还有浏览器正在做的所有其他事情,比如绘画。
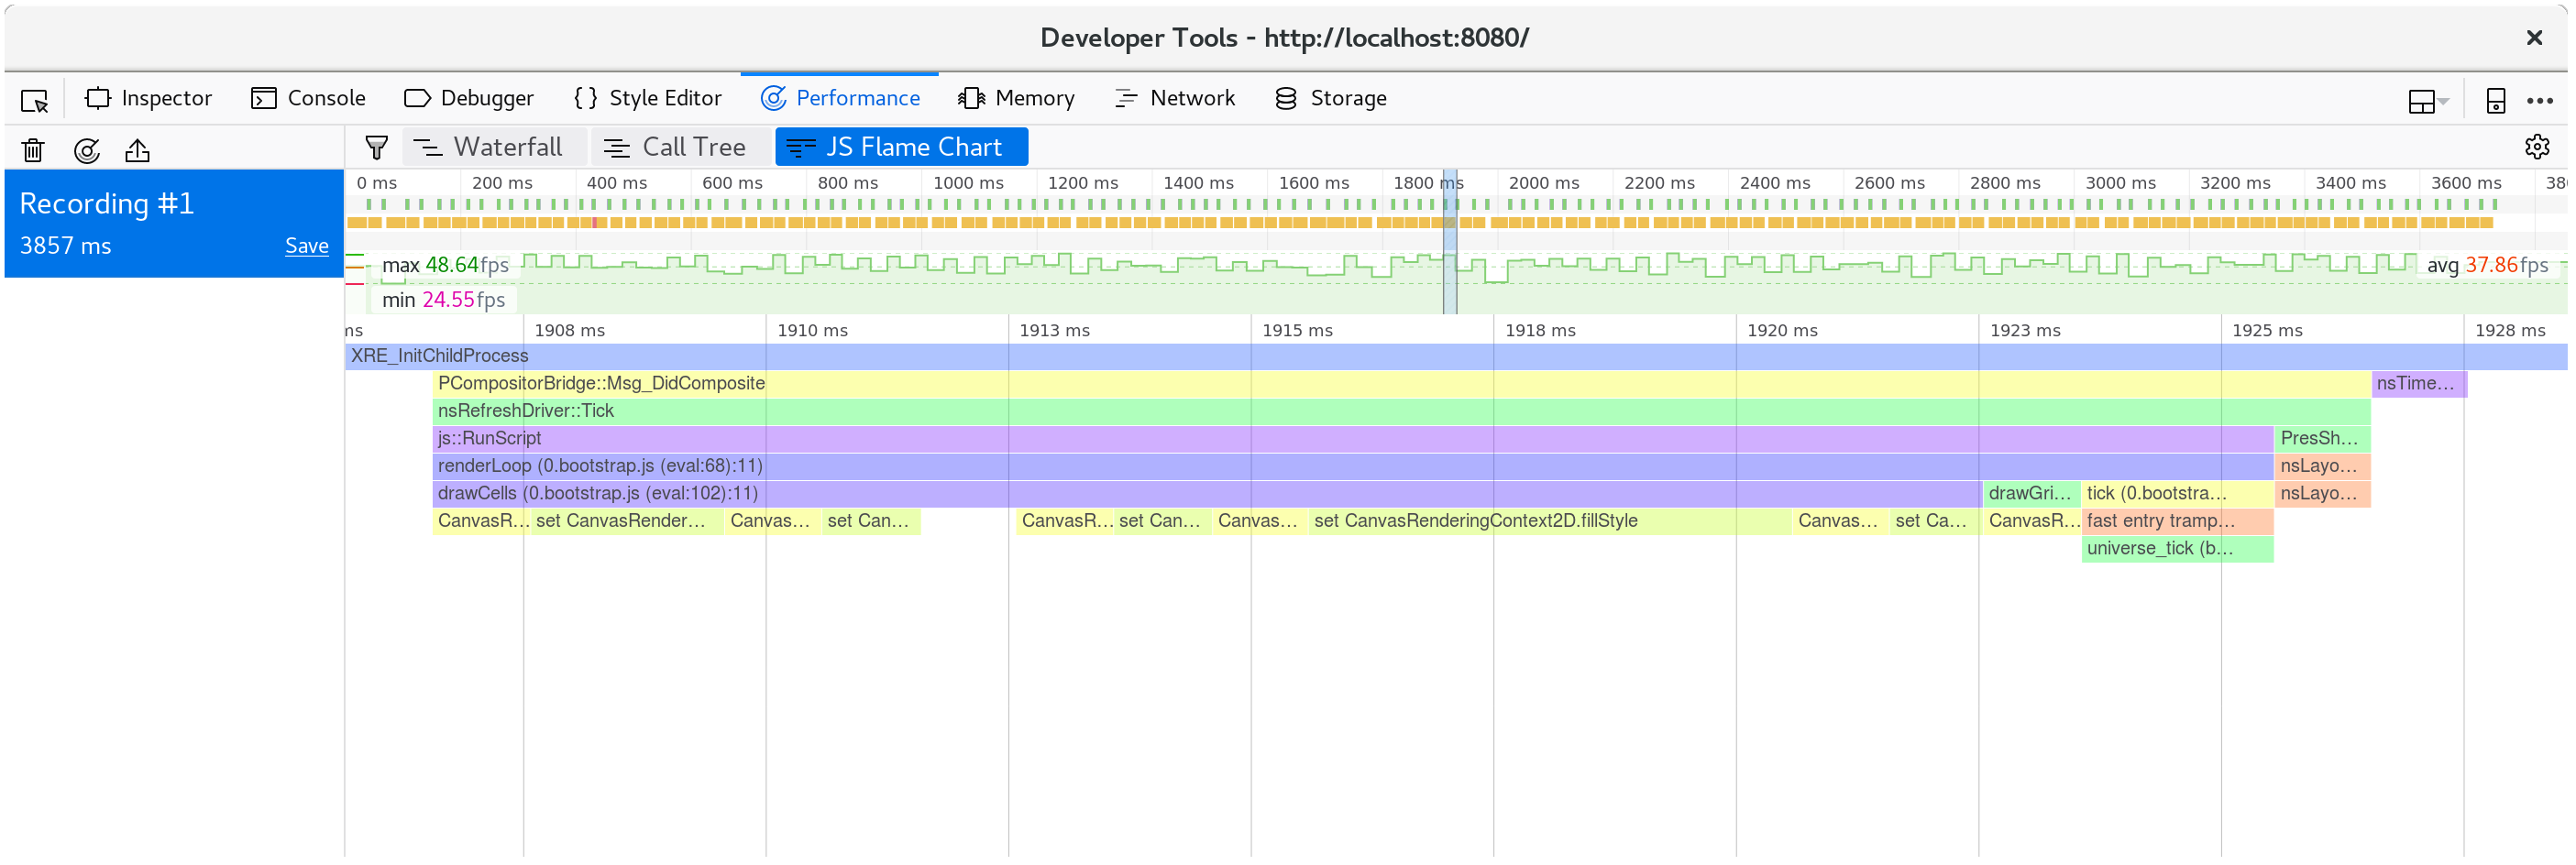
如果我们查看单个动画帧内发生的情况,我们会发现CanvasRenderingContext2D.fillStyle setter 非常昂贵!
⚠️ 在 Firefox 中,如果您看到一行简单地说“DOM” 而不是上面提到的“CanvasRenderingContext2D.fillStyle”, 则可能需要在性能开发人员工具选项中打开“显示 Gecko 平台数据”选项:
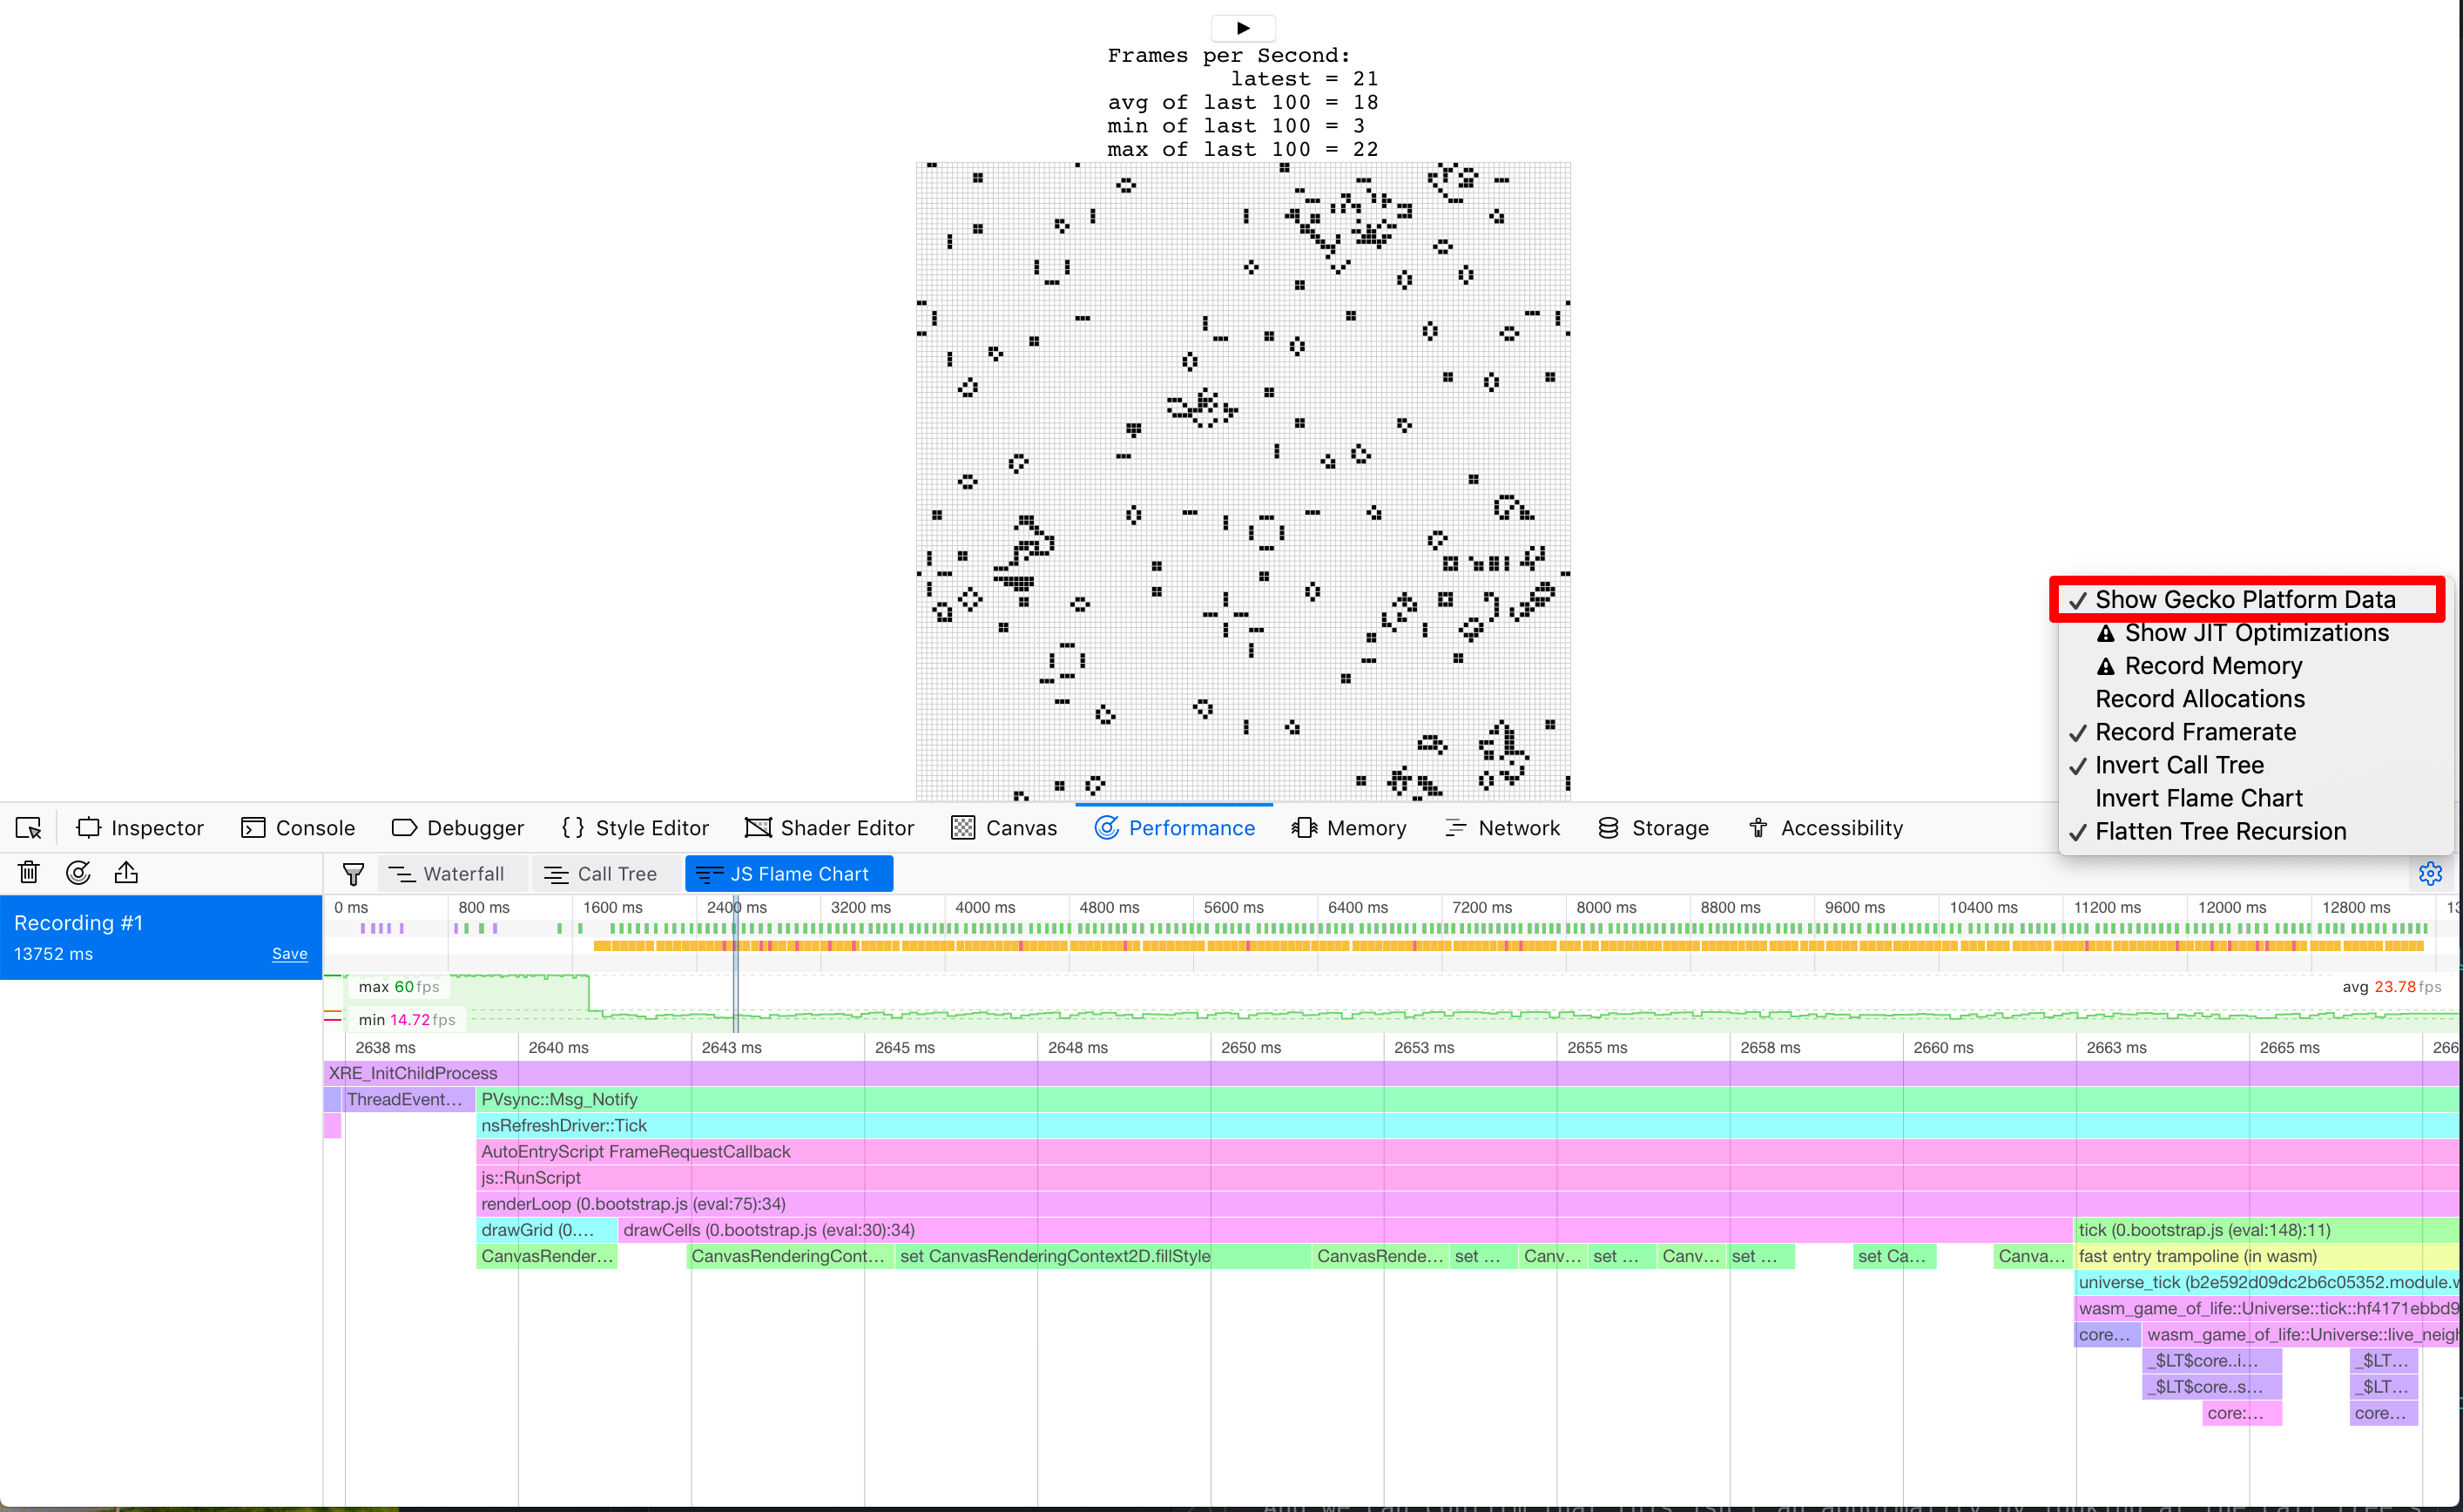
我们可以通过查看调用树的许多帧的聚合来确认这不是异常:
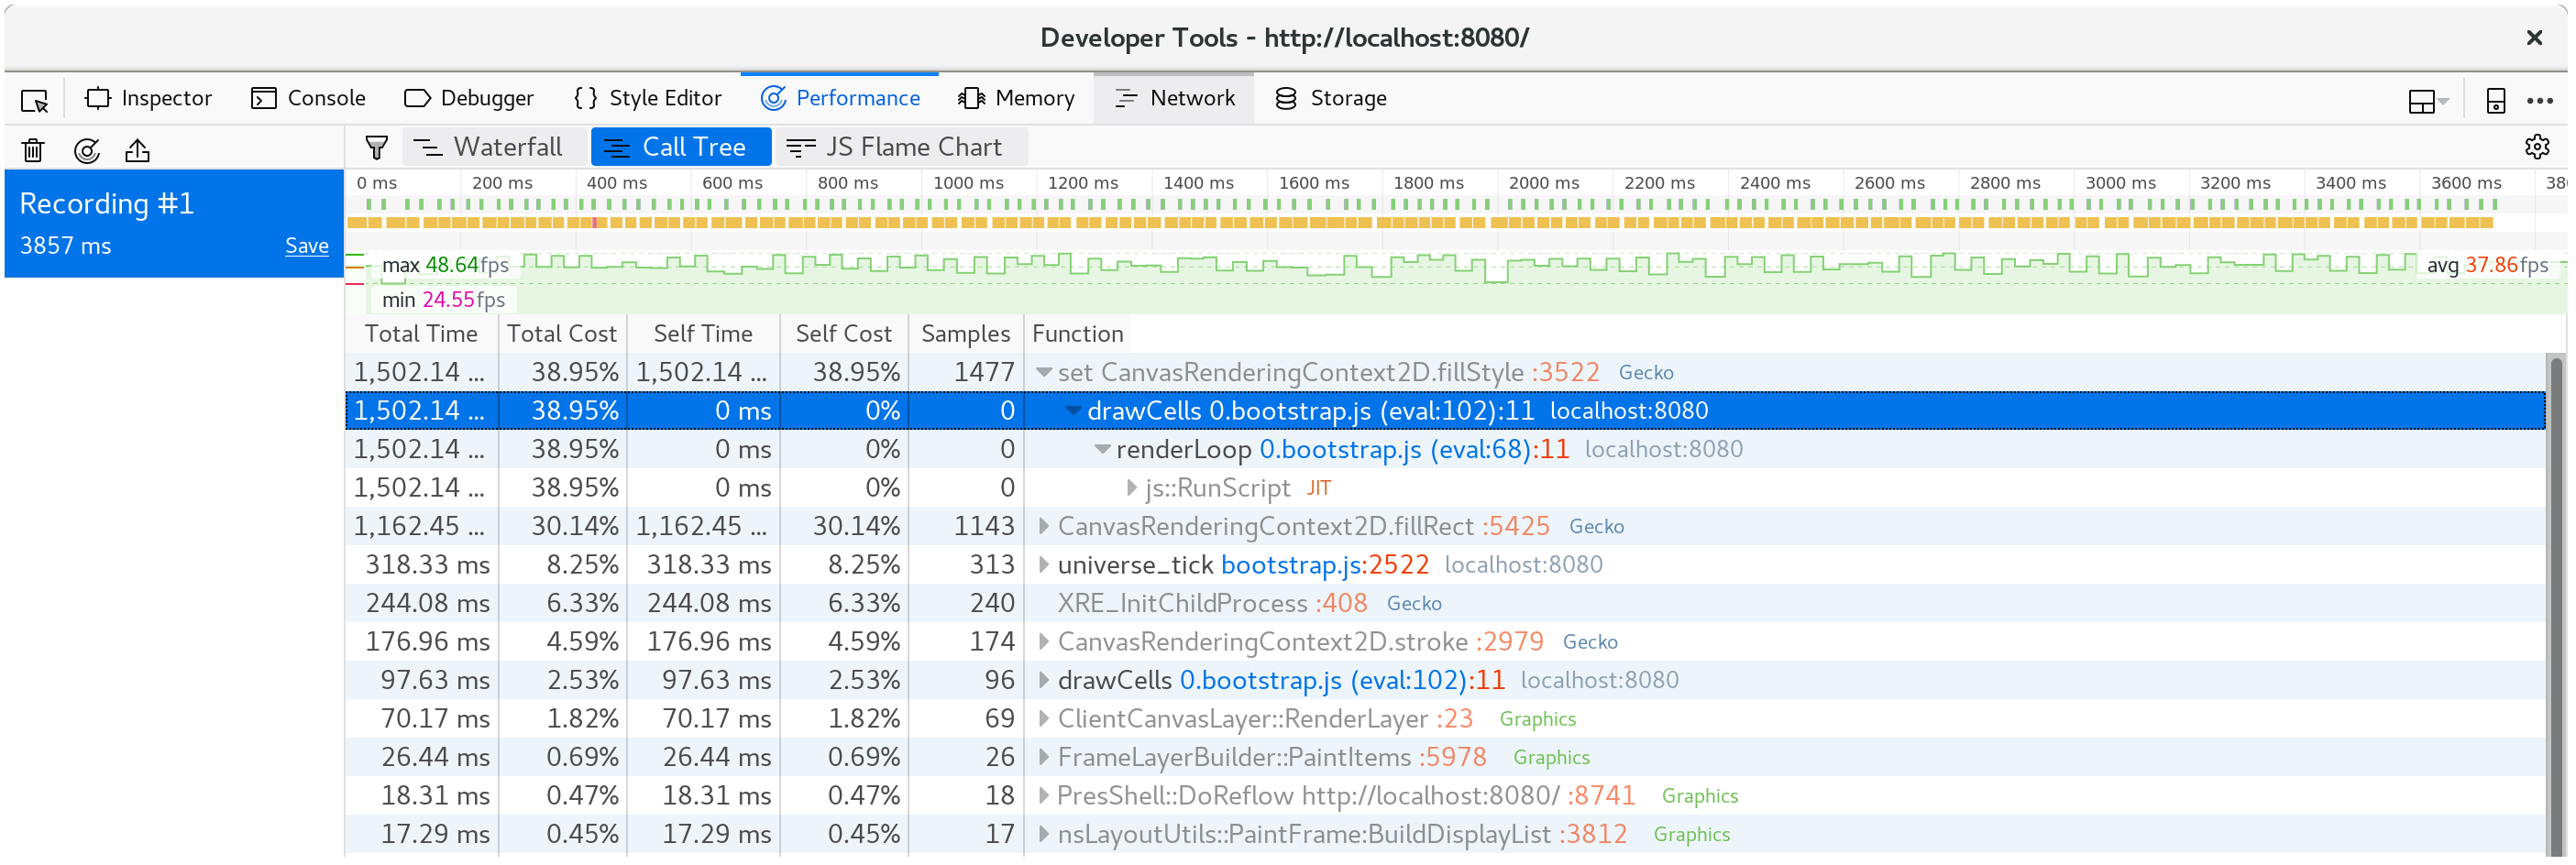
我们将近 40% 的时间都花在了这个 setter 上!
⚡ 我们可能已经预料到
tick方法中的某些东西会成为性能瓶颈, 但事实并非如此。 始终让分析引导您的注意力,因为时间可能会花在您不期望的地方。
在 wasm-game-of-life/www/index.js 的 drawCells 函数中,fillStyle 属性为 Universe 中的每个单元格在每个动画帧上设置一次:
for (let row = 0; row < height; row++) {
  for (let col = 0; col < width; col++) {
    const idx = getIndex(row, col);

    ctx.fillStyle = cells[idx] === DEAD
      ? DEAD_COLOR
      : ALIVE_COLOR;

    ctx.fillRect(
      col * (CELL_SIZE + 1) + 1,
      row * (CELL_SIZE + 1) + 1,
      CELL_SIZE,
      CELL_SIZE
    );
  }
}
既然我们已经发现设置fillStyle是如此昂贵,那么我们该如何做才能避免频繁地设置它?我们需要根据一个单元格是活的还是死的来改变fillStyle。如果我们设置fillStyle = ALIVE_COLOR,然后在一次绘制所有活着的单元格,然后设置fillStyle = DEAD_COLOR,在另一次绘制所有死亡的单元格,那么我们只需要设置fillStyle两次,而不是对每个单元格设置一次。
// Alive cells.
ctx.fillStyle = ALIVE_COLOR;
for (let row = 0; row < height; row++) {
  for (let col = 0; col < width; col++) {
    const idx = getIndex(row, col);
    if (cells[idx] !== Cell.Alive) {
      continue;
    }

    ctx.fillRect(
      col * (CELL_SIZE + 1) + 1,
      row * (CELL_SIZE + 1) + 1,
      CELL_SIZE,
      CELL_SIZE
    );
  }
}

// Dead cells.
ctx.fillStyle = DEAD_COLOR;
for (let row = 0; row < height; row++) {
  for (let col = 0; col < width; col++) {
    const idx = getIndex(row, col);
    if (cells[idx] !== Cell.Dead) {
      continue;
    }

    ctx.fillRect(
      col * (CELL_SIZE + 1) + 1,
      row * (CELL_SIZE + 1) + 1,
      CELL_SIZE,
      CELL_SIZE
    );
  }
}
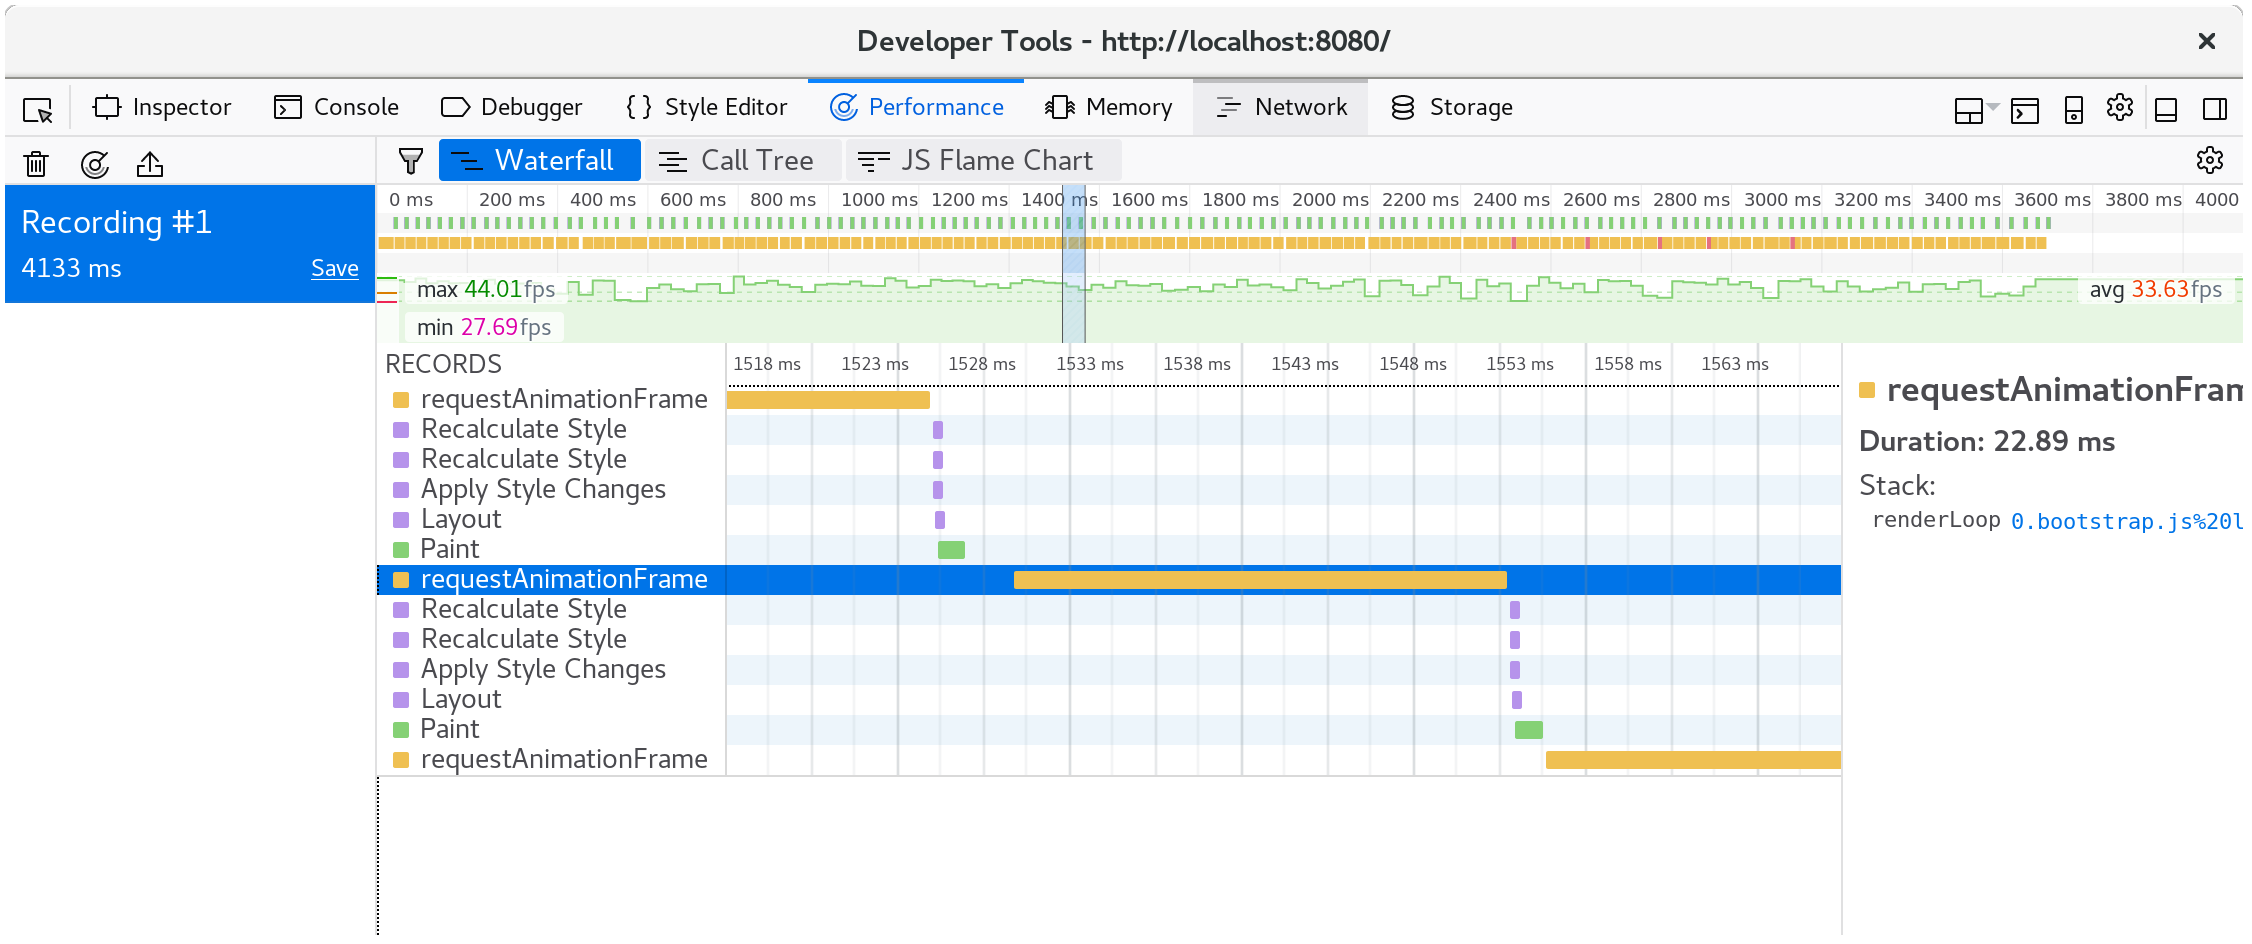
保存这些变化并刷新http://localhost:8080/后,渲染又恢复到每秒60帧的平稳状态。
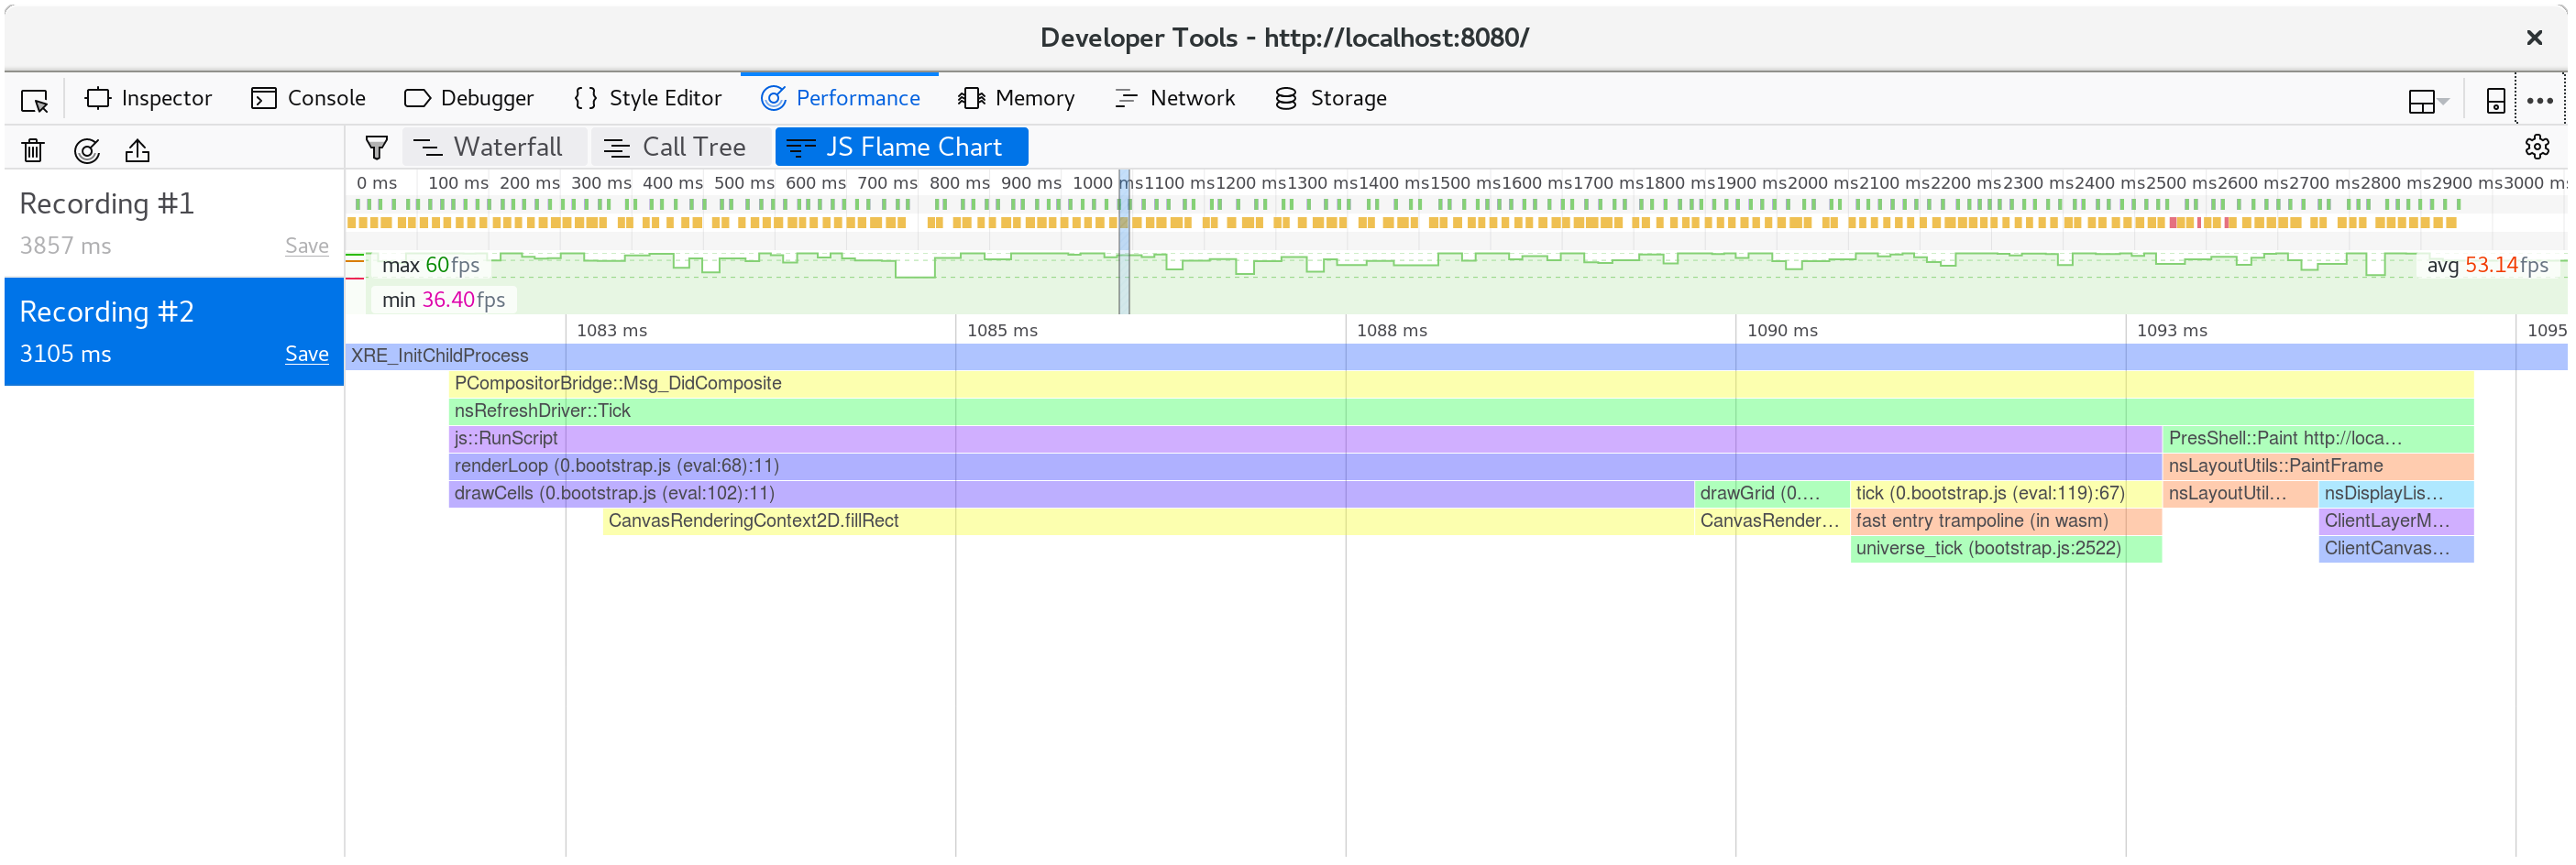
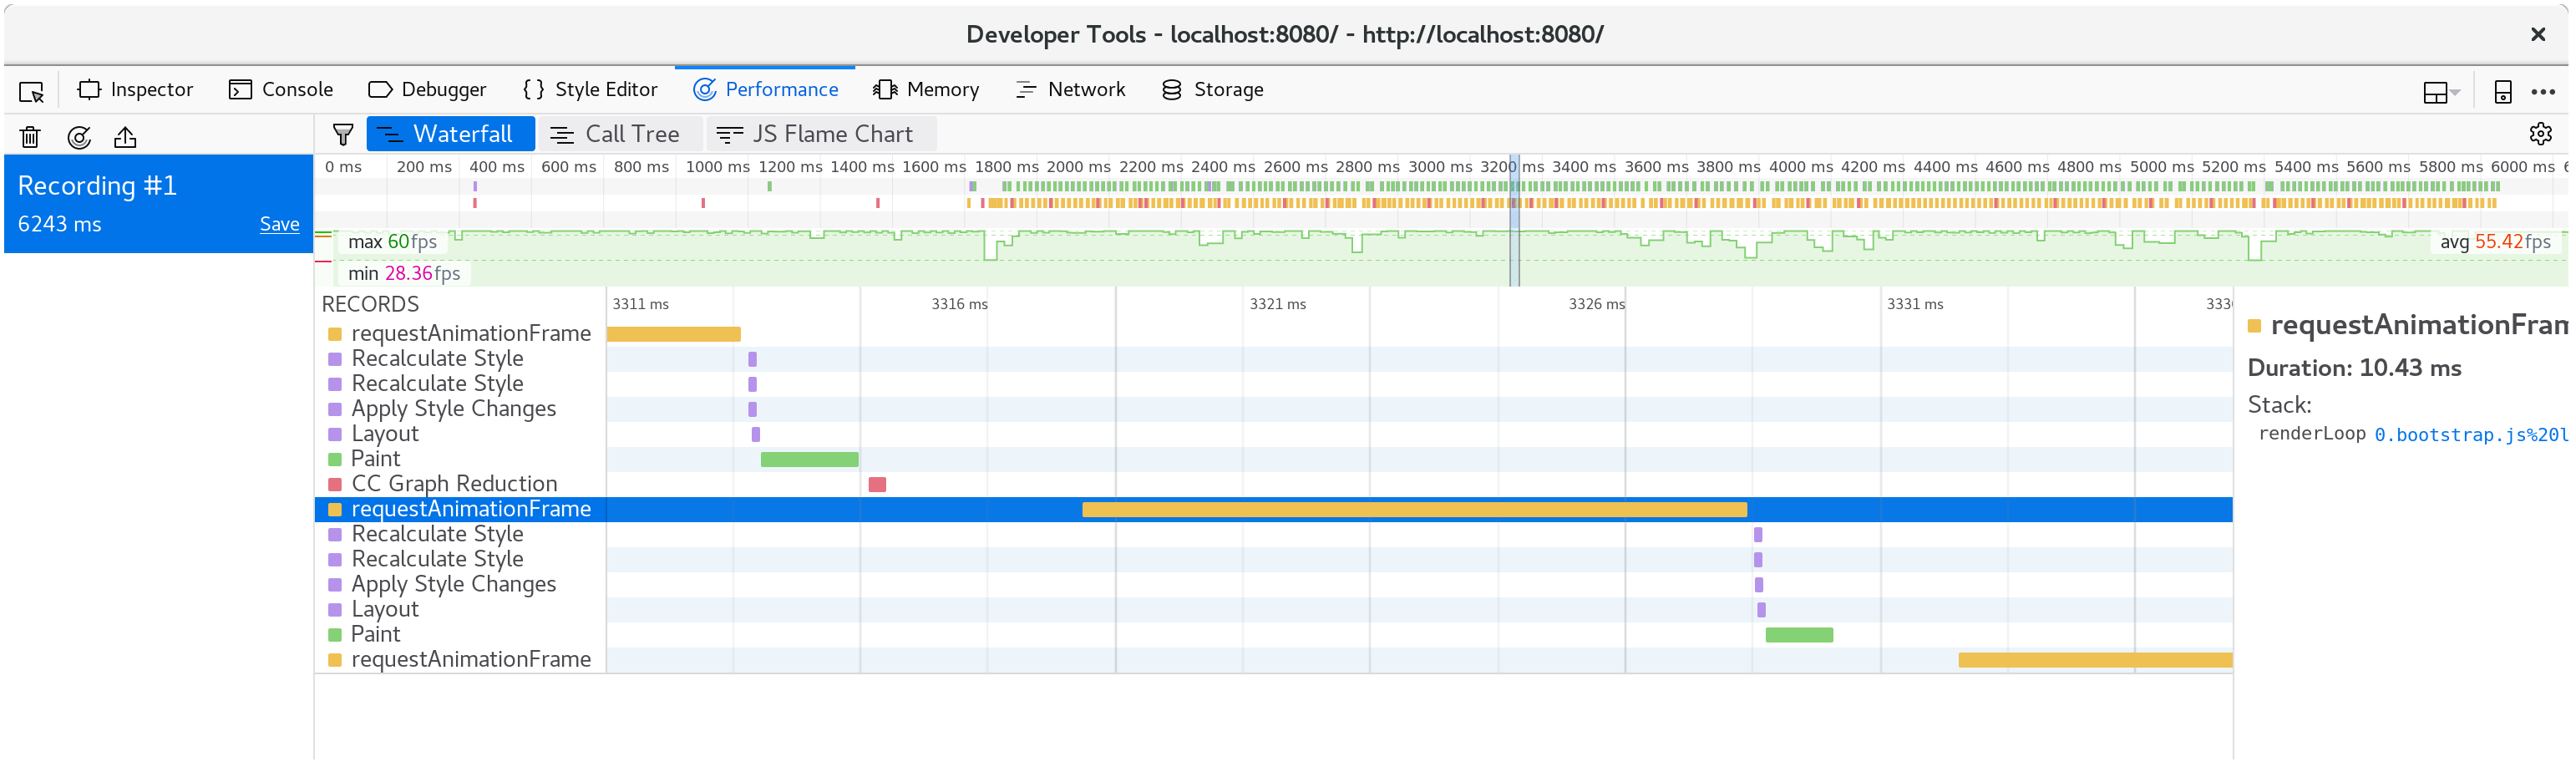
如果我们再拍一张剖面图,我们可以看到现在每个动画帧只花了大约10毫秒。
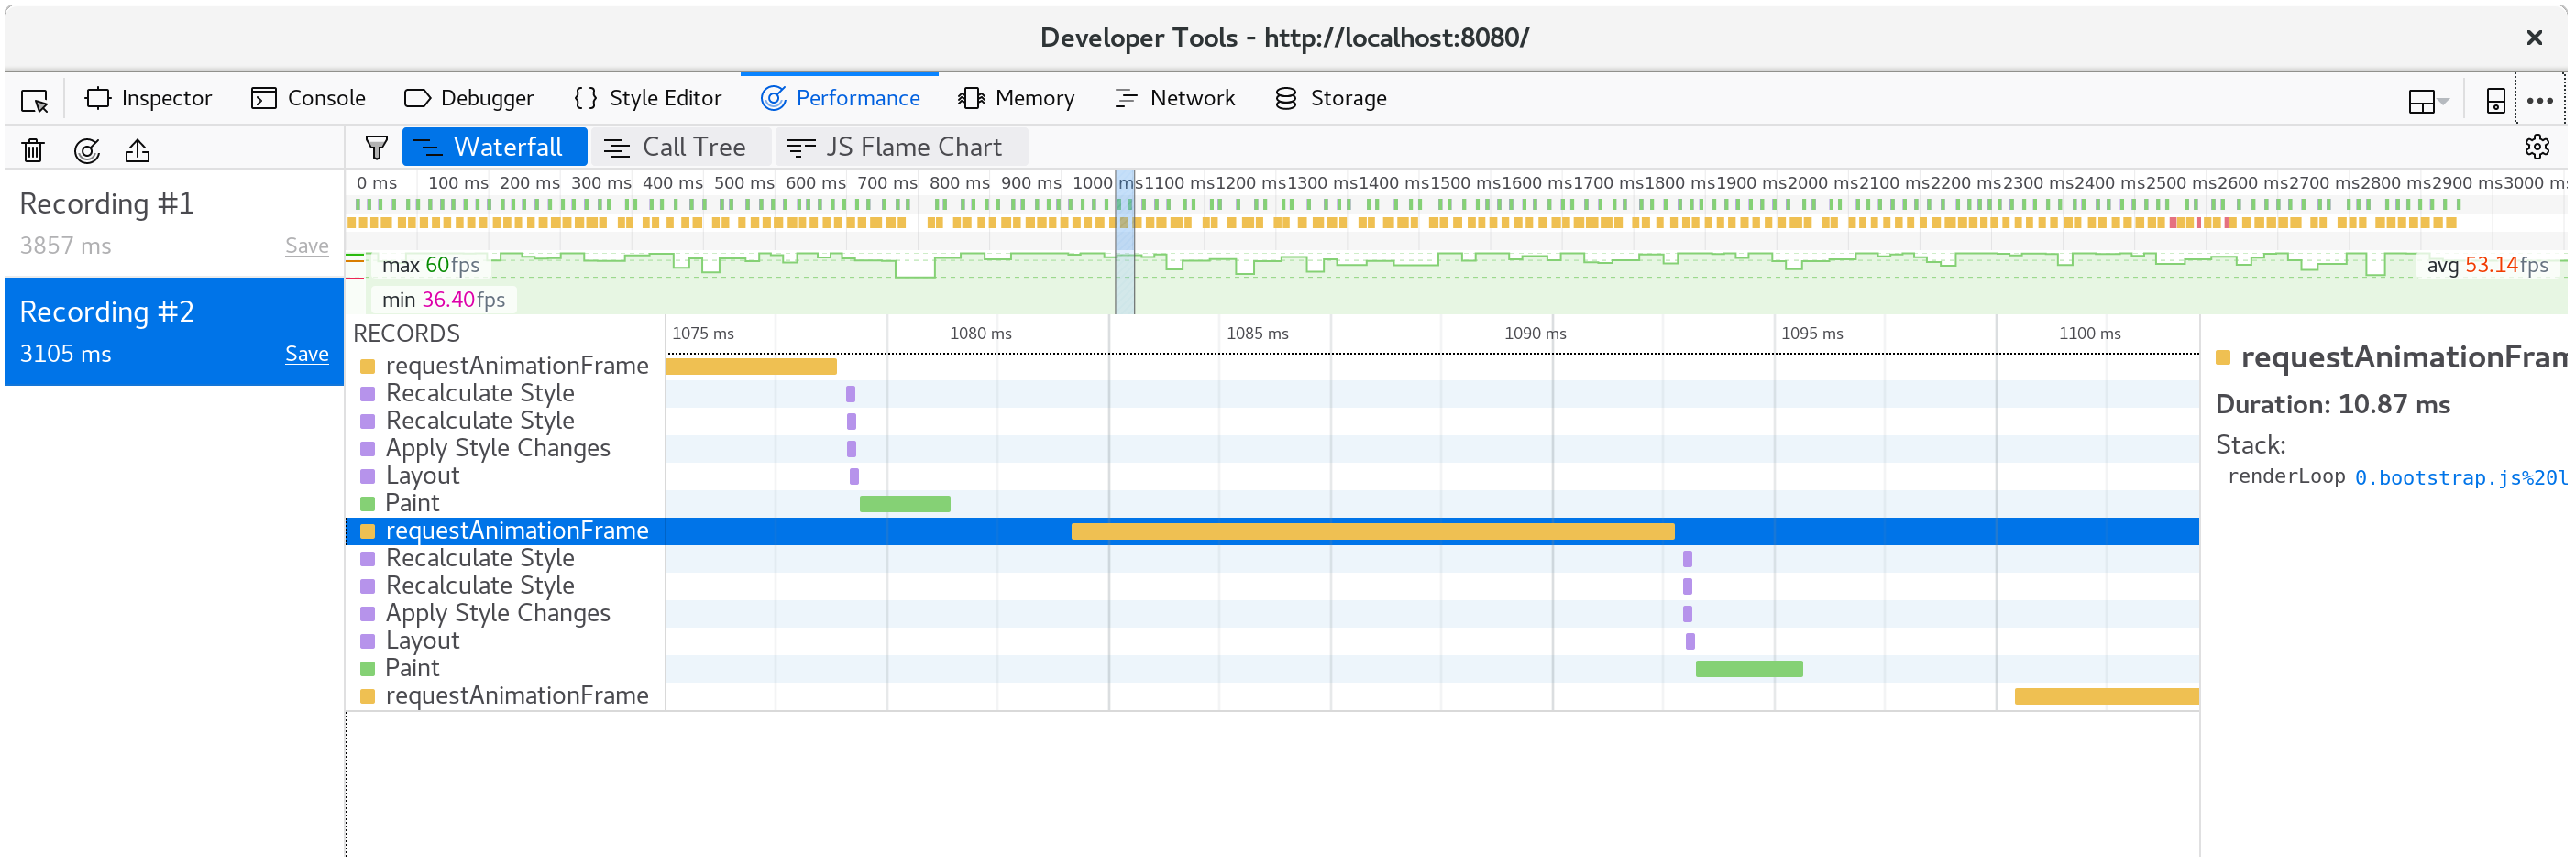
分解一个单一的框架,我们看到fillStyle的成本已经没有了,我们框架的大部分时间是在fillRect中度过的,绘制每个单元格的矩形。
让时间跑得更快
有些人不喜欢等待,他们希望每一帧动画不是发生一次宇宙的跳动,而是发生九次跳动。我们可以修改wasm-game-of-life/www/index.js中的renderLoop函数来实现这个目的。
for (let i = 0; i < 9; i++) {
  universe.tick();
}
在我的机器上,这使我们回落到每秒只有35帧。这可不好。我们要的是奶油般的60帧!
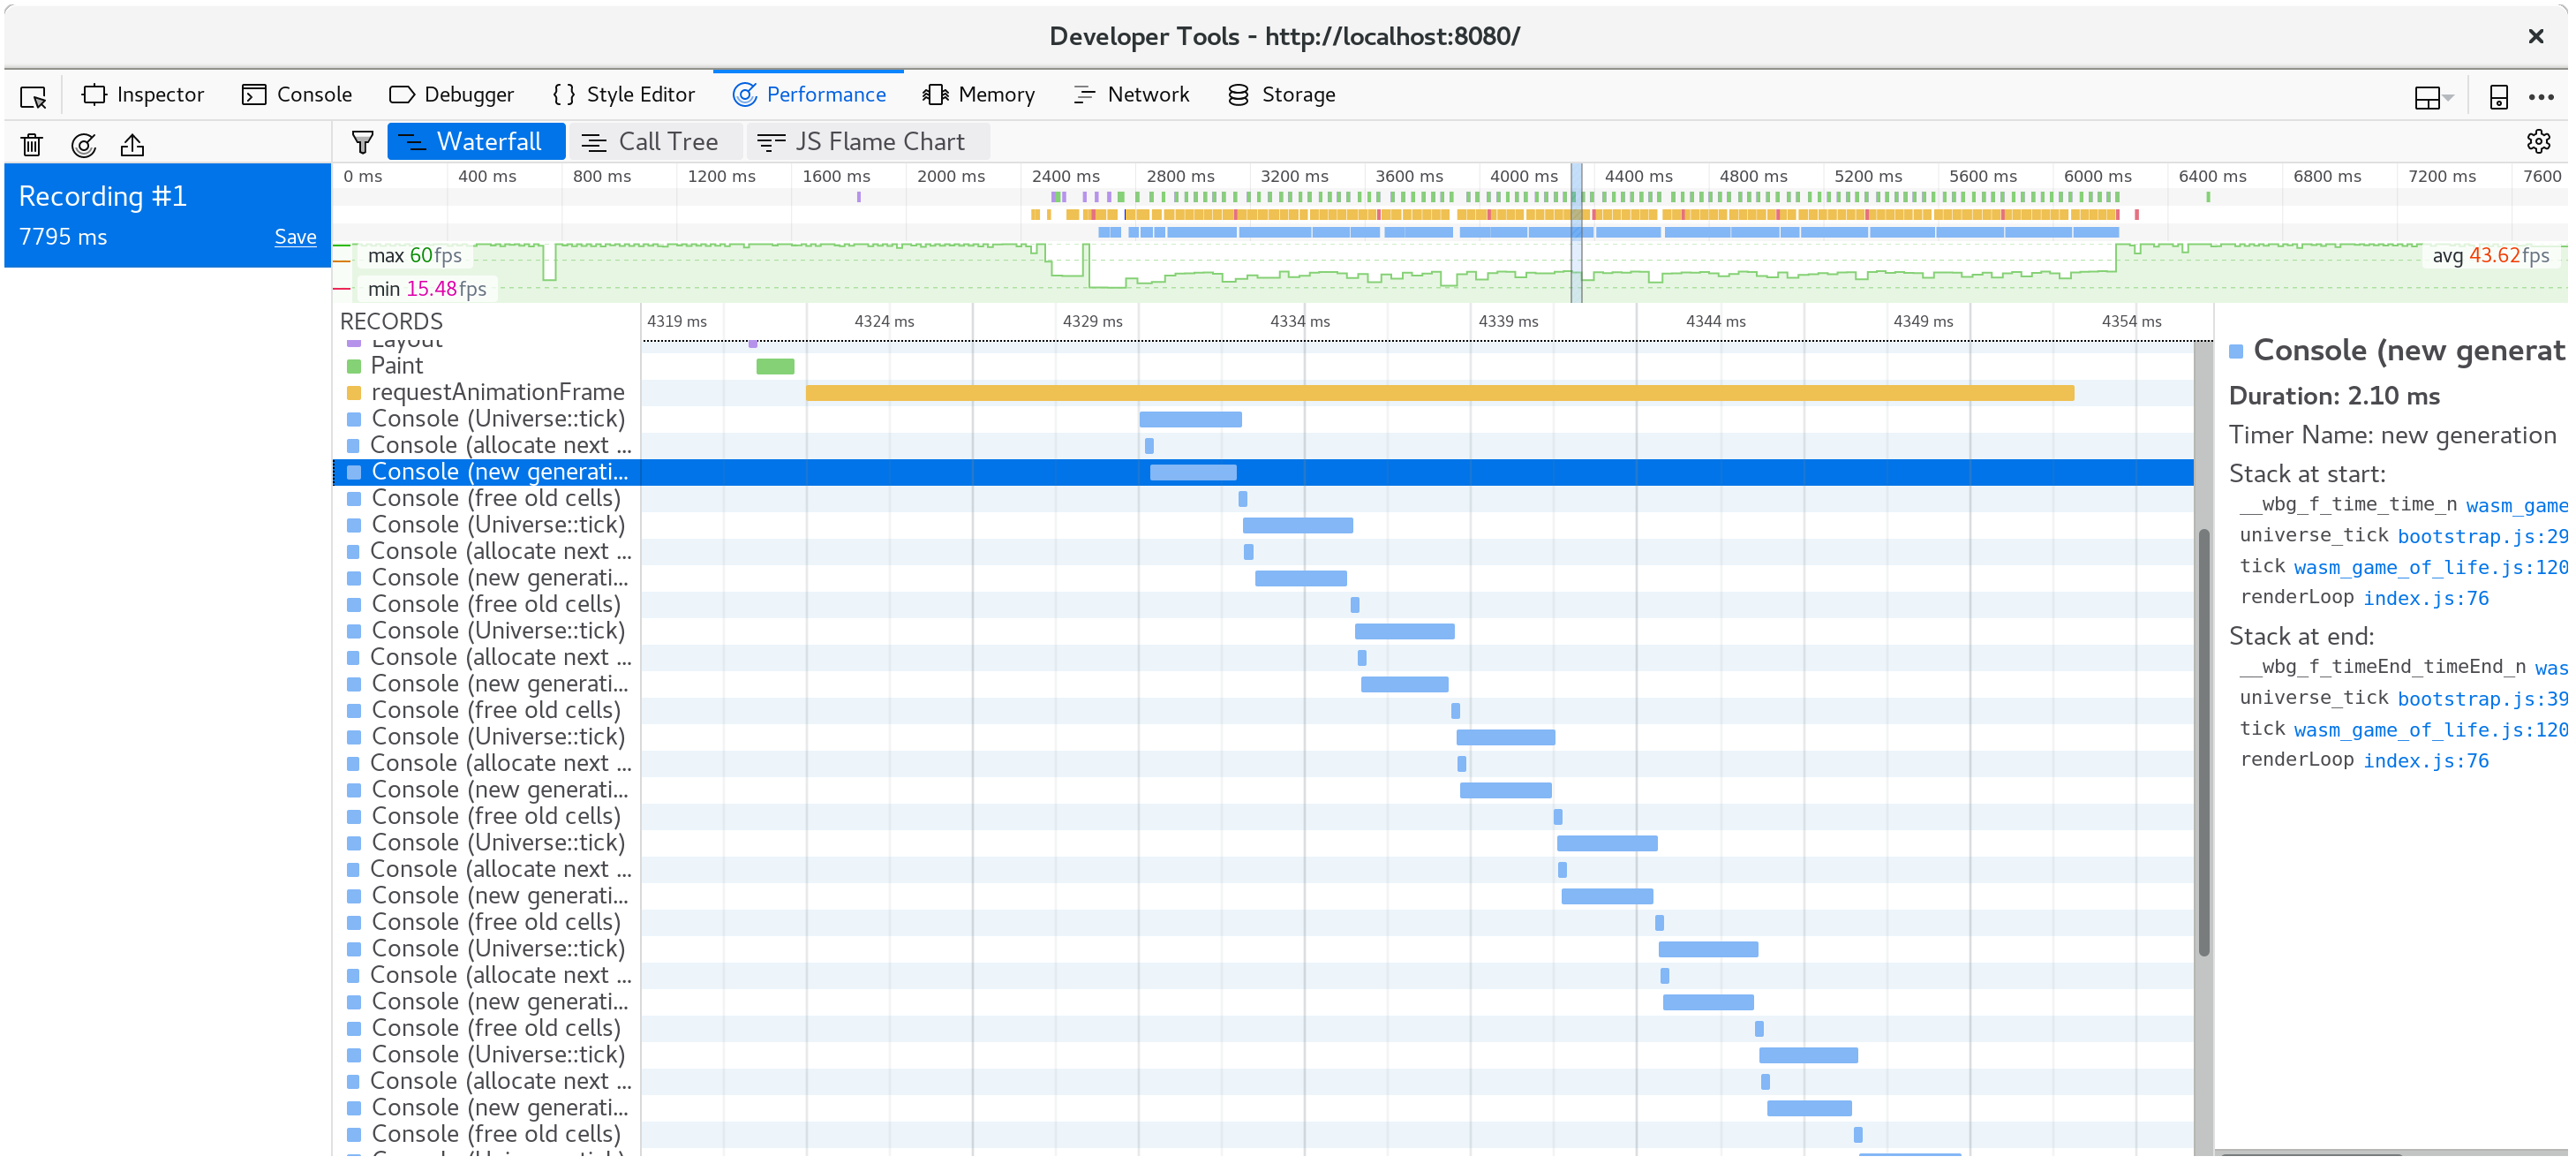
现在我们知道时间是在 Universe::tick 中度过的,所以让我们添加一些 Timer,在 console.time 和 console.timeEnd 的调用中包住它的各个部分,看看这将会给我们带来什么。我的假设是,在每个tick上分配一个新的单元格向量并释放旧的向量是昂贵的,并且占用了我们时间预算的很大一部分。
#![allow(unused)]
fn main() {
pub fn tick(&mut self) {
    let _timer = Timer::new("Universe::tick");

    let mut next = {
        let _timer = Timer::new("allocate next cells");
        self.cells.clone()
    };

    {
        let _timer = Timer::new("new generation");
        for row in 0..self.height {
            for col in 0..self.width {
                let idx = self.get_index(row, col);
                let cell = self.cells[idx];
                let live_neighbors = self.live_neighbor_count(row, col);

                let next_cell = match (cell, live_neighbors) {
                    // Rule 1: Any live cell with fewer than two live neighbours
                    // dies, as if caused by underpopulation.
                    (Cell::Alive, x) if x < 2 => Cell::Dead,
                    // Rule 2: Any live cell with two or three live neighbours
                    // lives on to the next generation.
                    (Cell::Alive, 2) | (Cell::Alive, 3) => Cell::Alive,
                    // Rule 3: Any live cell with more than three live
                    // neighbours dies, as if by overpopulation.
                    (Cell::Alive, x) if x > 3 => Cell::Dead,
                    // Rule 4: Any dead cell with exactly three live neighbours
                    // becomes a live cell, as if by reproduction.
                    (Cell::Dead, 3) => Cell::Alive,
                    // All other cells remain in the same state.
                    (otherwise, _) => otherwise,
                };

                next[idx] = next_cell;
            }
        }
    }

    let _timer = Timer::new("free old cells");
    self.cells = next;
}
}
看一下时间,很明显我的假设是不正确的:绝大部分时间都花在了实际计算下一代的单元上。令人惊讶的是,在每次勾选时分配和释放一个载体的成本似乎可以忽略不计。又一次提醒我们要始终用剖析来指导我们的工作!
下一节要求使用nightly编译器。之所以需要它,是因为我们要用test feature gate来做基准测试。我们要安装的另一个工具是cargo benchcmp。它是一个小工具,用于比较由cargo bench产生的微观基准。
让我们写一个本地代码#[bench],做与我们的WebAssembly相同的事情,但在这里我们可以使用更成熟的剖析工具。这里是新的wasm-game-of-life/benches/bench.rs。
#![allow(unused)]
#![feature(test)]

fn main() {
extern crate test;
extern crate wasm_game_of_life;

#[bench]
fn universe_ticks(b: &mut test::Bencher) {
    let mut universe = wasm_game_of_life::Universe::new();

    b.iter(|| {
        universe.tick();
    });
}
}
我们还必须注释掉所有的#[wasm_bindgen]注释,以及Cargo.toml中的"dylib"位,否则构建本地代码会失败,并出现链接错误。
有了这些,我们就可以运行cargo bench | tee before.txt来编译和运行我们的基准测试了 | tee before.txt部分将从cargo bench中获取输出,并放入一个名为before.txt的文件。
$ cargo bench | tee before.txt
    Finished release [optimized + debuginfo] target(s) in 0.0 secs
     Running target/release/deps/wasm_game_of_life-91574dfbe2b5a124

running 0 tests

test result: ok. 0 passed; 0 failed; 0 ignored; 0 measured; 0 filtered out

     Running target/release/deps/bench-8474091a05cfa2d9

running 1 test
test universe_ticks ... bench:     664,421 ns/iter (+/- 51,926)

test result: ok. 0 passed; 0 failed; 0 ignored; 1 measured; 0 filtered out
This also tells us where the binary lives, and we can run the benchmarks again,
but this time under our operating system's profiler. In my case, I'm running
Linux, so perf is the profiler I'll use:
$ perf record -g target/release/deps/bench-8474091a05cfa2d9 --bench
running 1 test
test universe_ticks ... bench:     635,061 ns/iter (+/- 38,764)

test result: ok. 0 passed; 0 failed; 0 ignored; 1 measured; 0 filtered out

[ perf record: Woken up 1 times to write data ]
[ perf record: Captured and wrote 0.178 MB perf.data (2349 samples) ]
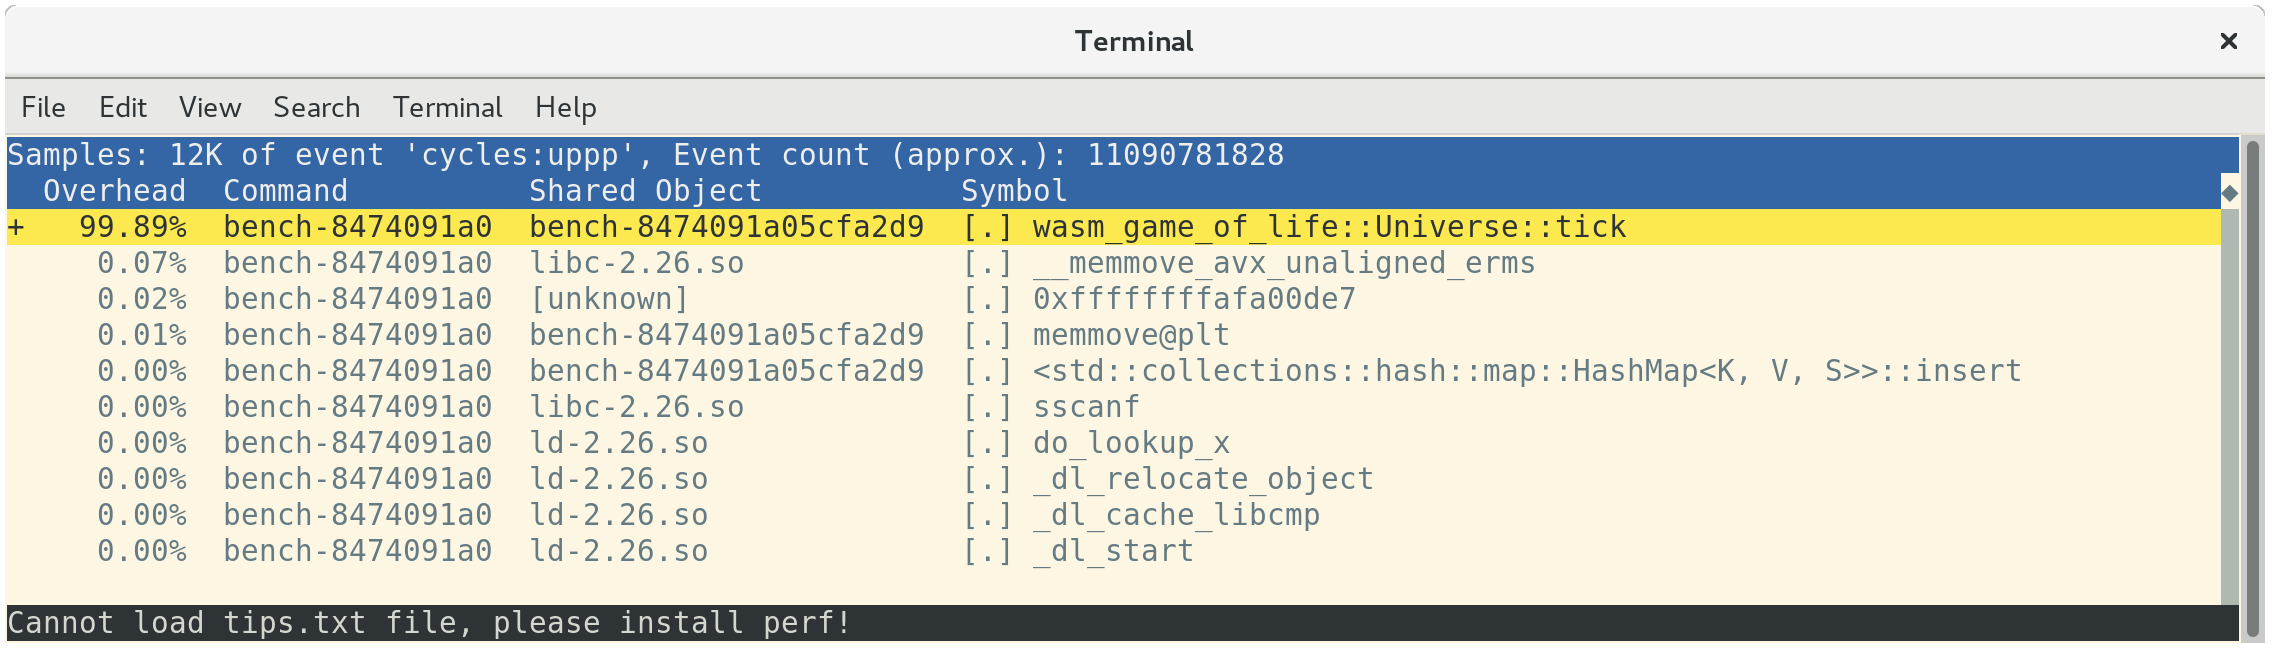
用 perf report 加载配置文件显示,我们所有的时间都花在了 Universe::tick 上,正如预期:
如果你按下a,perf 将注解函数中的哪些指令正在花费时间:
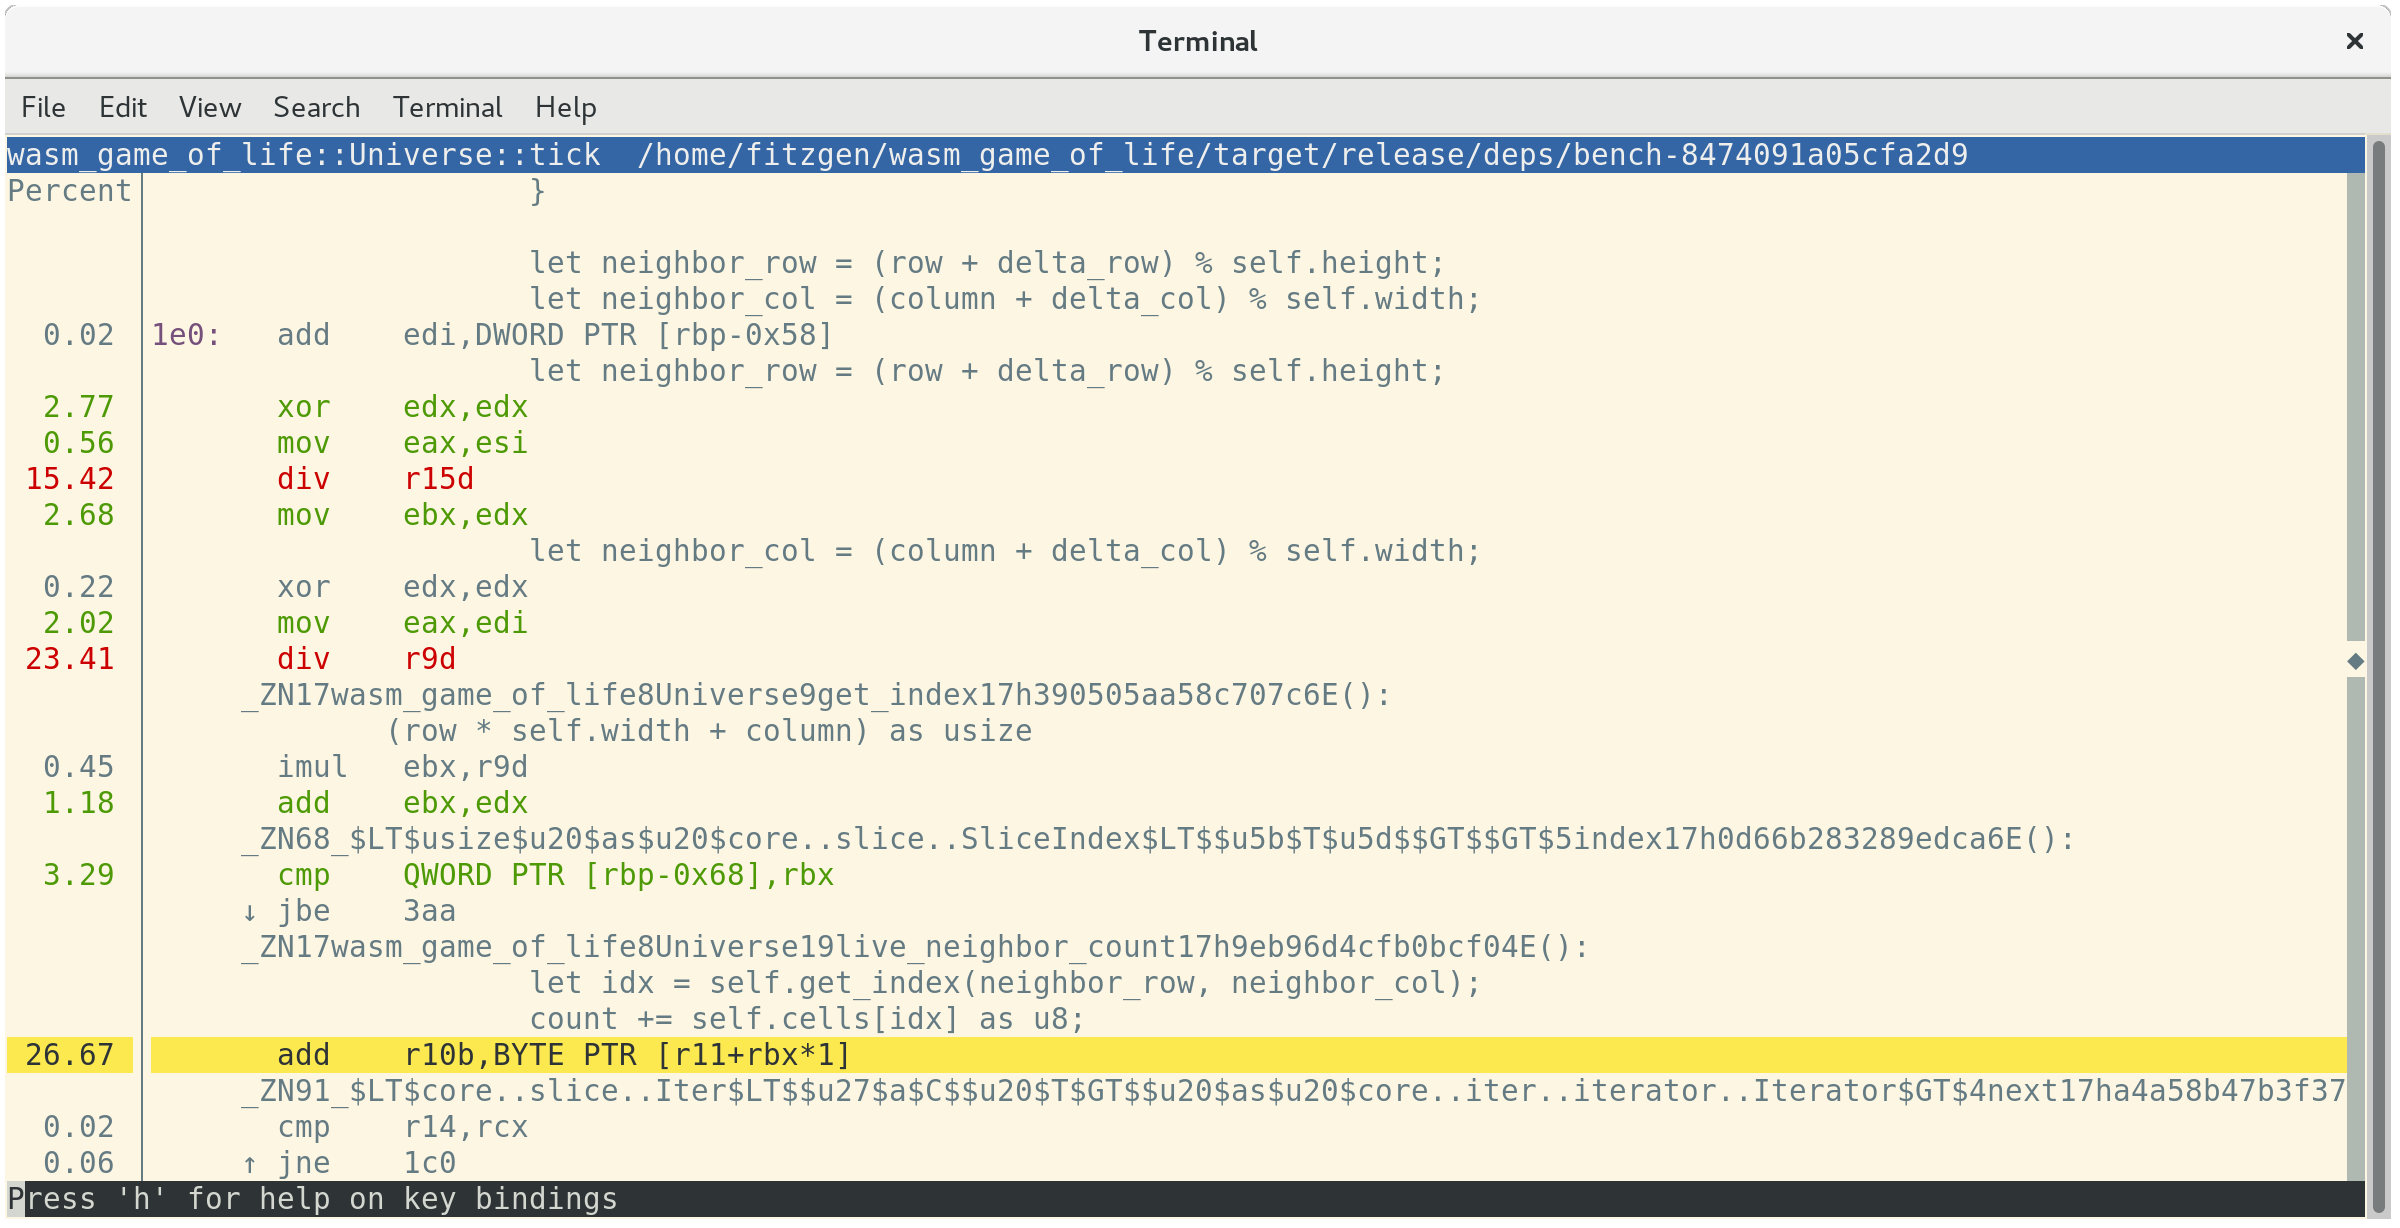
这告诉我们,26.67%的时间花在相邻单元格的数值相加上,23.41%的时间花在获取相邻的列索引上,另外15.42%的时间花在获取相邻的行索引上。在这前三个最昂贵的指令中,第二和第三条都是昂贵的div指令。这些div实现了Universe::live_neighbor_count中的模数索引逻辑。
回顾一下wasm-game-of-life/src/lib.rs中的live_neighbor_count定义:
#![allow(unused)]
fn main() {
fn live_neighbor_count(&self, row: u32, column: u32) -> u8 {
    let mut count = 0;
    for delta_row in [self.height - 1, 0, 1].iter().cloned() {
        for delta_col in [self.width - 1, 0, 1].iter().cloned() {
            if delta_row == 0 && delta_col == 0 {
                continue;
            }

            let neighbor_row = (row + delta_row) % self.height;
            let neighbor_col = (column + delta_col) % self.width;
            let idx = self.get_index(neighbor_row, neighbor_col);
            count += self.cells[idx] as u8;
        }
    }
    count
}
}
我们使用模数的原因是为了避免在第一或最后一行或一列的边缘情况下用if分支使代码变得混乱。但是,即使在最常见的情况下,我们也要付出div指令的代价,当row和column都不在宇宙的边缘,它们不需要模数包装处理。相反,如果我们使用ifs来处理边缘情况,并解开这个循环,分支应该被CPU的分支预测器很好地预测到。
让我们这样重写live_neighbor_count:
#![allow(unused)]
fn main() {
fn live_neighbor_count(&self, row: u32, column: u32) -> u8 {
    let mut count = 0;

    let north = if row == 0 {
        self.height - 1
    } else {
        row - 1
    };

    let south = if row == self.height - 1 {
        0
    } else {
        row + 1
    };

    let west = if column == 0 {
        self.width - 1
    } else {
        column - 1
    };

    let east = if column == self.width - 1 {
        0
    } else {
        column + 1
    };

    let nw = self.get_index(north, west);
    count += self.cells[nw] as u8;

    let n = self.get_index(north, column);
    count += self.cells[n] as u8;

    let ne = self.get_index(north, east);
    count += self.cells[ne] as u8;

    let w = self.get_index(row, west);
    count += self.cells[w] as u8;

    let e = self.get_index(row, east);
    count += self.cells[e] as u8;

    let sw = self.get_index(south, west);
    count += self.cells[sw] as u8;

    let s = self.get_index(south, column);
    count += self.cells[s] as u8;

    let se = self.get_index(south, east);
    count += self.cells[se] as u8;

    count
}
}
现在让我们再运行一次基准测试! 这次把它输出到after.txt。
$ cargo bench | tee after.txt
   Compiling wasm_game_of_life v0.1.0 (file:///home/fitzgen/wasm_game_of_life)
    Finished release [optimized + debuginfo] target(s) in 0.82 secs
     Running target/release/deps/wasm_game_of_life-91574dfbe2b5a124

running 0 tests

test result: ok. 0 passed; 0 failed; 0 ignored; 0 measured; 0 filtered out

     Running target/release/deps/bench-8474091a05cfa2d9

running 1 test
test universe_ticks ... bench:      87,258 ns/iter (+/- 14,632)

test result: ok. 0 passed; 0 failed; 0 ignored; 1 measured; 0 filtered out
这看起来好了很多! 我们可以通过benchcmp工具和我们之前创建的两个文本文件看到它有多好:
$ cargo benchcmp before.txt after.txt
 name            before.txt ns/iter  after.txt ns/iter  diff ns/iter   diff %  speedup
 universe_ticks  664,421             87,258                 -577,163  -86.87%   x 7.61
哇!7.61倍的速度
WebAssembly有意与常见的硬件架构紧密映射,但我们确实需要确保这种本地代码的速度也能转化为WebAssembly的速度。
让我们用wasm-pack build重建.wasm并刷新[http://localhost:8080/](http://localhost:8080/)。在我的机器上,该页面再次以每秒60帧的速度运行,用浏览器的剖析器记录另一个剖析,发现每个动画帧大约需要10毫秒。
成功了!
练习
-
在这一点上,加快
Universe::tick的下一个最低的目标是取消分配和释放。实现单元格的双重缓冲,即Universe维护两个向量,不释放其中任何一个,并且不在tick中分配新的缓冲。 -
实现 "实现生命 "一章中的另一种基于delta的设计,Rust代码将改变状态的单元格的列表返回给JavaScript。这是否使渲染到
<canvas>的速度更快?你能实现这种设计而不在每次勾选时分配一个新的deltas列表吗? -
正如我们的分析所显示的,2D
<canvas>的渲染不是特别快。用WebGL渲染器取代2D画布渲染器。WebGL版本的速度有多大?在WebGL渲染成为瓶颈之前,你能把宇宙做得多大?